Observability
Observability records local Claude Code usage metadata such as token totals, tool activity, models, sessions, and estimated costs. The intended policy is per-repository opt-in. Shared service setup consent and project opt-in are separate decisions. The shared observer and Collector are machine-wide, while project settings decide which repository should participate.
The telemetry schema is designed to exclude prompt or response text, code or file contents, tool inputs or results, credentials, and environment values. Sink configuration stays in the private local observability config. Current limitation: the hook and ingest path does not enforce the repository opt-in at its collection boundary. Hook events can enter the shared spool and ingest path before the repository check. Treat per-repository opt-in as intended policy, not a hard runtime privacy guarantee, until runtime enforcement is fixed. This documentation does not claim that fix or offer a workaround.
Start here
Section titled “Start here”- Install the Observability plugin.
- From the repository you want to watch, run
/observability:enable-project-telemetry. - Give separate consent for the machine-shared observer and Collector, then opt this repository into the service.
- Choose local SQLite only, or explicitly request the Docker dashboard with
--dashboard. - Restart every Claude Code session already running in the affected repository directories. A plugin reload alone does not apply the new environment.
- Create fresh activity, then open the dashboard and verify the result.
The skill handles the observer, dashboard setup, project wiring, and verification. It reports whether the local observer, Collector, downstream sink, and dashboard are healthy as separate planes. A linked worktree’s hook events can resolve to the main repository identity, while native Claude Code metrics still require the exact session-start directory to be wired.
Daily use
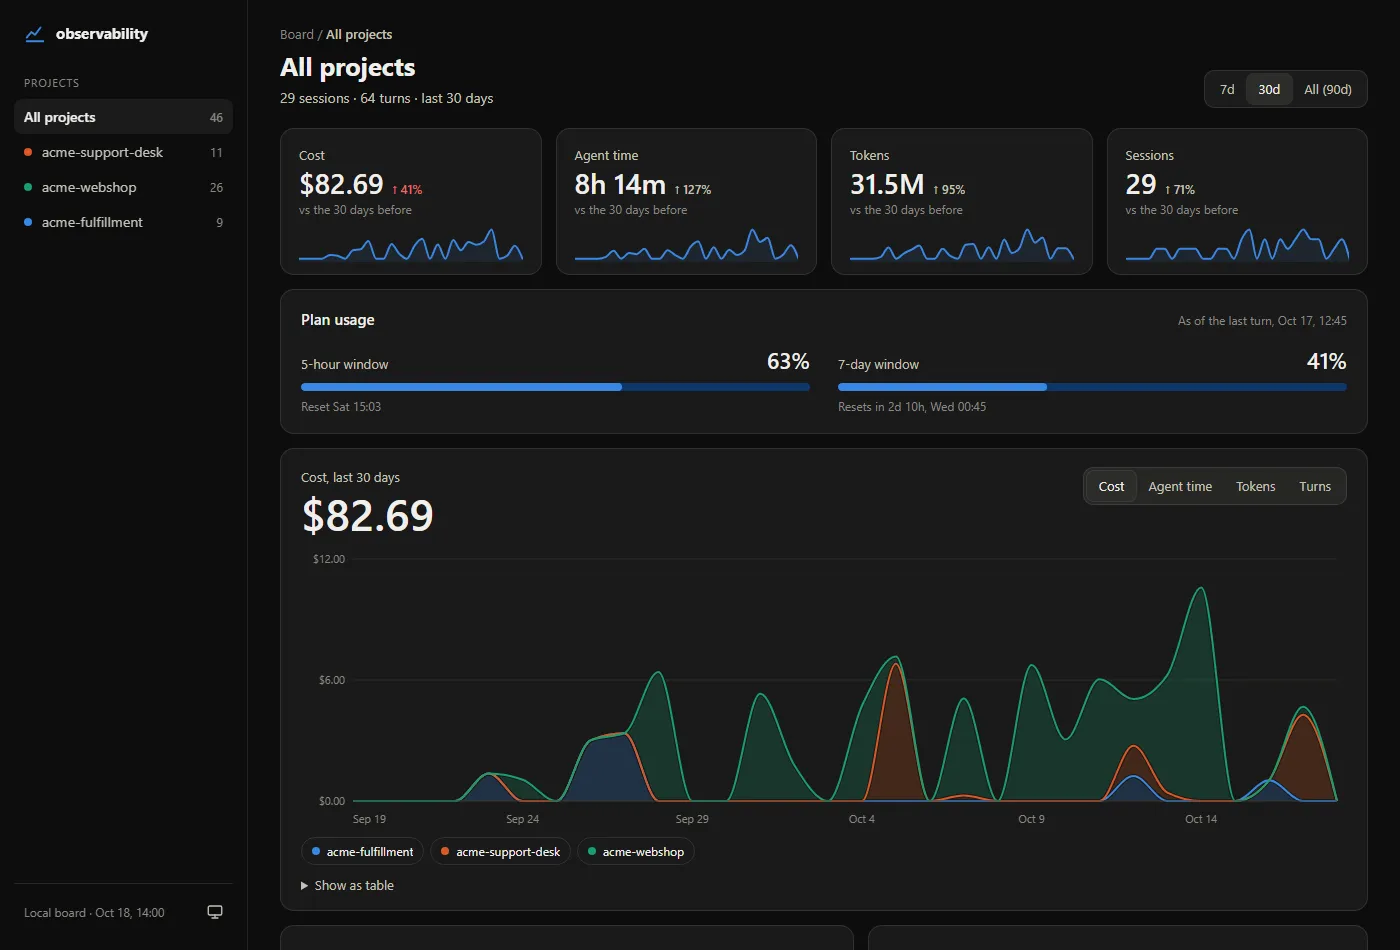
Section titled “Daily use”Open the configured loopback dashboard, usually http://127.0.0.1:3000, to compare usage across opted-in repositories or focus on one project. Use it to spot model and token use, API list-price-equivalent costs, tool activity, MCP activity, Sidequest costs, and failures. Estimated API-equivalent costs are not subscription charges. A model without a published API price appears in Unpriced model token usage with its resolved model name and token volume, while cost totals exclude it. See the dashboard guide for the main views.
Pricing and cost panels
Section titled “Pricing and cost panels”The dashboard shows API list-price-equivalent estimates for models with a maintained public price map. Those figures are never actual subscription spend. The cache-read, cache-write, input, and output buckets follow the resolved model and provider’s pricing semantics, so do not apply one provider’s cache rules to another provider.
GPT-6 Astra uses the maintained OpenAI model and pricing authorities, including the OpenAI API pricing page and the GPT-6 Astra model page. Anthropic model rates come from the Anthropic pricing documentation. The dashboard selects a public-price tier per request where the authority defines one. Unknown, virtual, or otherwise unpriced models remain visible in Unpriced model token usage with token volumes and no invented USD total.
Work routed to Codex is the API-equivalent cost for resolved Codex gateway requests divided by total priced API-equivalent cost in the selected time range. It is not a token percentage, and it excludes unpriced usage from both the priced numerator and denominator. The dashboard’s displayed cost uses the same maintained price map and selected time range. Neither measure reports what a subscription provider will charge.
To check setup or disable telemetry, run the same skill and describe what you want. Claude reports whether a project is sending data and tells you when a restart or more activity is needed.
Health and statusline signals
Section titled “Health and statusline signals”The observer’s GET /health endpoint returns 200 when it is healthy and 503 when it has a health failure. For an enabled outbox, outbox_stalled means records are pending but the sender’s last attempt is older than its retry interval. outbox_not_draining means the oldest pending record has been waiting more than 120 seconds. The codes distinguish a sender that stopped attempting from a backlog that is aging while still pending.
When the observer reports an unhealthy response, the status line appends a compact obs: <error> badge, such as obs: outbox_not_draining. A healthy observer, or an observer that cannot be reached, adds no badge.
Storage pressure
Section titled “Storage pressure”The local observer keeps a 128 MiB writable reserve below its 4 GiB database limit. Its normal retention window is 30 days. It removes data past that window first, then removes the oldest whole days inside the window when pressure remains, so pressure can prune data earlier than 30 days. Health reports the pressure state, action, remaining headroom, and exact removed windows and row counts.
Freed SQLite pages stay available to new telemetry. The managed observer does not need a full VACUUM; the standalone retention command checks filesystem space before any blocking file-space reclaim. Retention pruning and user-requested deletion of local history are separate actions. If no removable data restores the reserve, health reports storage_headroom_unrecoverable while committed ingestion keeps its normal acknowledgement.
If the dashboard is empty
Section titled “If the dashboard is empty”Tell Claude:
My Observability dashboard is empty. Check the project setup and tell me what to fix.
Existing sessions need a restart after opt-in, and that restart must happen before creating activity or running verification. A project also needs fresh Claude Code activity before its panels appear. A dashboard outage does not stop local observer ingestion. The outbox retries a failed delivery up to eight times. If rows become exhausted, ask Claude to show the pre-action pending_count and exhausted_count plus health, get approval for the explicit requeue action, then report the post-action counts and health. POST /v1/outbox/requeue resets every exhausted row in the shared local outbox, not just one project’s rows, so do not describe it as project-scoped recovery.
If a generated dashboard is stale, reset it with --reset-dashboards, create fresh activity, and run setup or let SessionStart reprovision the current definitions. Fully reload the Grafana browser tab after reprovisioning. Grafana Refresh reruns queries already loaded in the page and does not replace stale dashboard definitions. Verify the project after fresh activity and report found or not-found as returned. Do not claim telemetry is flowing before the verifier says found. If the local service is unavailable, ask Claude to diagnose the observer, Collector, downstream sink, and dashboard separately. The observer health response includes hook-spool failures, the last error, and any quarantined poison file.
See the generated Observability reference for the agent-facing setup and command contract.